Trade with Greece
166
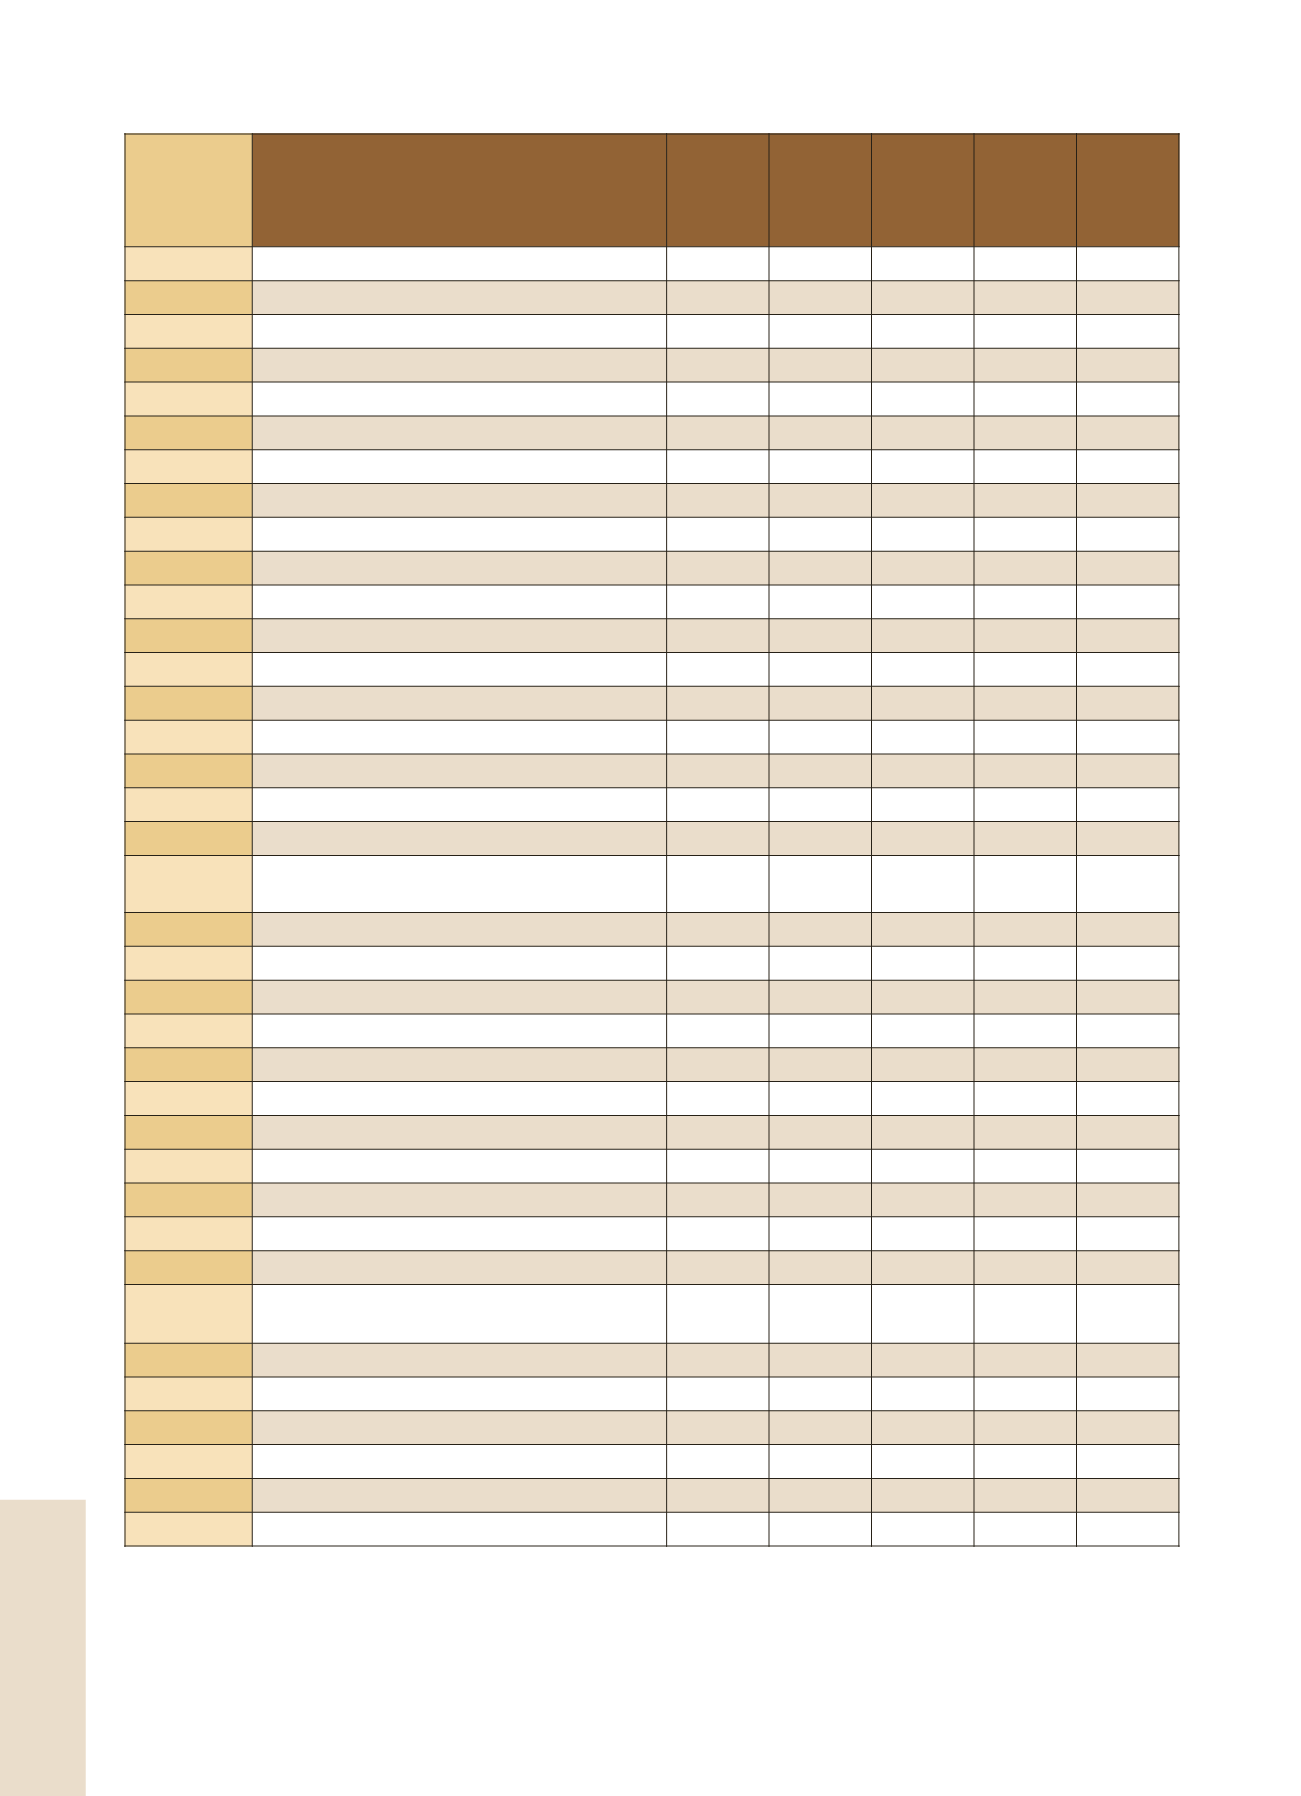
Annual rates of change of the Turnover Index in Industry for the Domestic Market
*Provisional data
Note: 1. The indices are calculated with infinite decimal figures and are rounded up to one decimal figure when published.
2. Percentage changes are calculated on the basis of indices with infinite decimal figures and are rounded up to one decimal figure
when published.
(2005 = 100.0)
Branch code
Branch name
November
2010*
November
2009
November
2009
Rate of
change
(%)2010*
/2009
Rate of
change
(%) 2009/
2008
Overall Index
92.6
95.2
107.6 -2.7
-11.5
B
MINING AND QUARRYING
90.4
103.2 114.9
-12.4
-10.2
05
Mining of coal and lignite
118.5
268.3 187.3 -55.8
43.3
06
Extraction of crude petroleum and natural gas 0.0
0.0
0.0
-
-
07
Mining of metal ores
114.3
93.5
92.2
22.2
1.4
08
Other mining and quarrying
94.1
101.1 124.1 -6.9
-18.6
C
MANUFACTURING
91.3
93.7
105.9 -2.6
-11.5
10
Food
111.6
109.7 111.0
1.7
-1.2
11
Beverages
79.4
77.1
77.4
3.0
-0.5
12
Tobacco products
57.0
84.7
84.2
-32.7
0.6
13
Textiles
49.2
59.4
73.9
-17.2
-19.6
14
Wearing apparel
58.3
84.0
99.6
-30.6
-15.7
15
Leather and related products
56.2
86.4
101.7 -34.9
-15.0
16
Wood and cork
59.9
73.9
103.8 -19.0
-28.8
17
Paper and paper products
121.0 119.2
117.1
1.5
1.8
18
Printing and recording services
78.4
95.9
116.4
-18.2
-17.6
19
Coke and refined petroleum products
109.4 102.3 112.2
6.9
-8.8
20
Chemicals and chemical products
70.6
65.6
71.7
7.6
-8.5
21
Basic pharmaceutical products and pharma-
ceutical preparations
104.5 125.2 105.2 -16.5
19.0
22
Rubber and plastic products
85.8
86.9
97.5
-1.2
-10.9
23
Other non-metallic mineral products
75.6
96.2
113.7
-21.4
-15.4
24
Basic metals
86.9
82.4
112.1
5.4
-26.5
25
Fabricated metal products
82.0
87.3
100.1 -6.0
-12.8
26
Computers, electronic and optical products 45.1
49.1
90.5
-8.1
-45.7
27
Electrical equipment
100.5 87.8
95.6
14.4
-8.1
28
Machinery and equipment n. e. c.
65.7
103.4 102.9 -36.5
0.5
29
Motor vehicles, trailers and semi-trailers
23.1
89.9
86.6
-74.3
3.8
30
Other transport equipment
28.2
40.6
137.6 -30.4
-70.5
31
Furniture
74.2
93.2
119.6
-20.4
-22.1
32
Other manufactured goods
53.4
62.7
80.3
-14.9
-21.9
33
Repair and installation services of machin-
ery and equipment
60.0
68.6
114.1
-12.5
-39.9
Main Industrial Groupings
1
Energy
108.9 102.5 112.0
6.3
-8.5
2
Intermediate goods
88.5
91.4
107.6 -3.1
-15.1
3
Capital goods
56.4
72.8
109.7 -22.6
-33.6
4
Consumer Durables
70.1
81.7
105.0 -14.2
-22.2
5
Consumer Non-Durables
90.9
96.3
97.9
-5.6
-1.6
The decrease of the Turnover Index in Industry for the domestic market by 2.7% in November 2010, as compared to
November 2009, was due to a 12.4% decrease in the Mining and Quarrying Turnover Index and a 2.6% decrease in the
Turnover Index of Manufacturing Industries.


