Trade with Greece
160
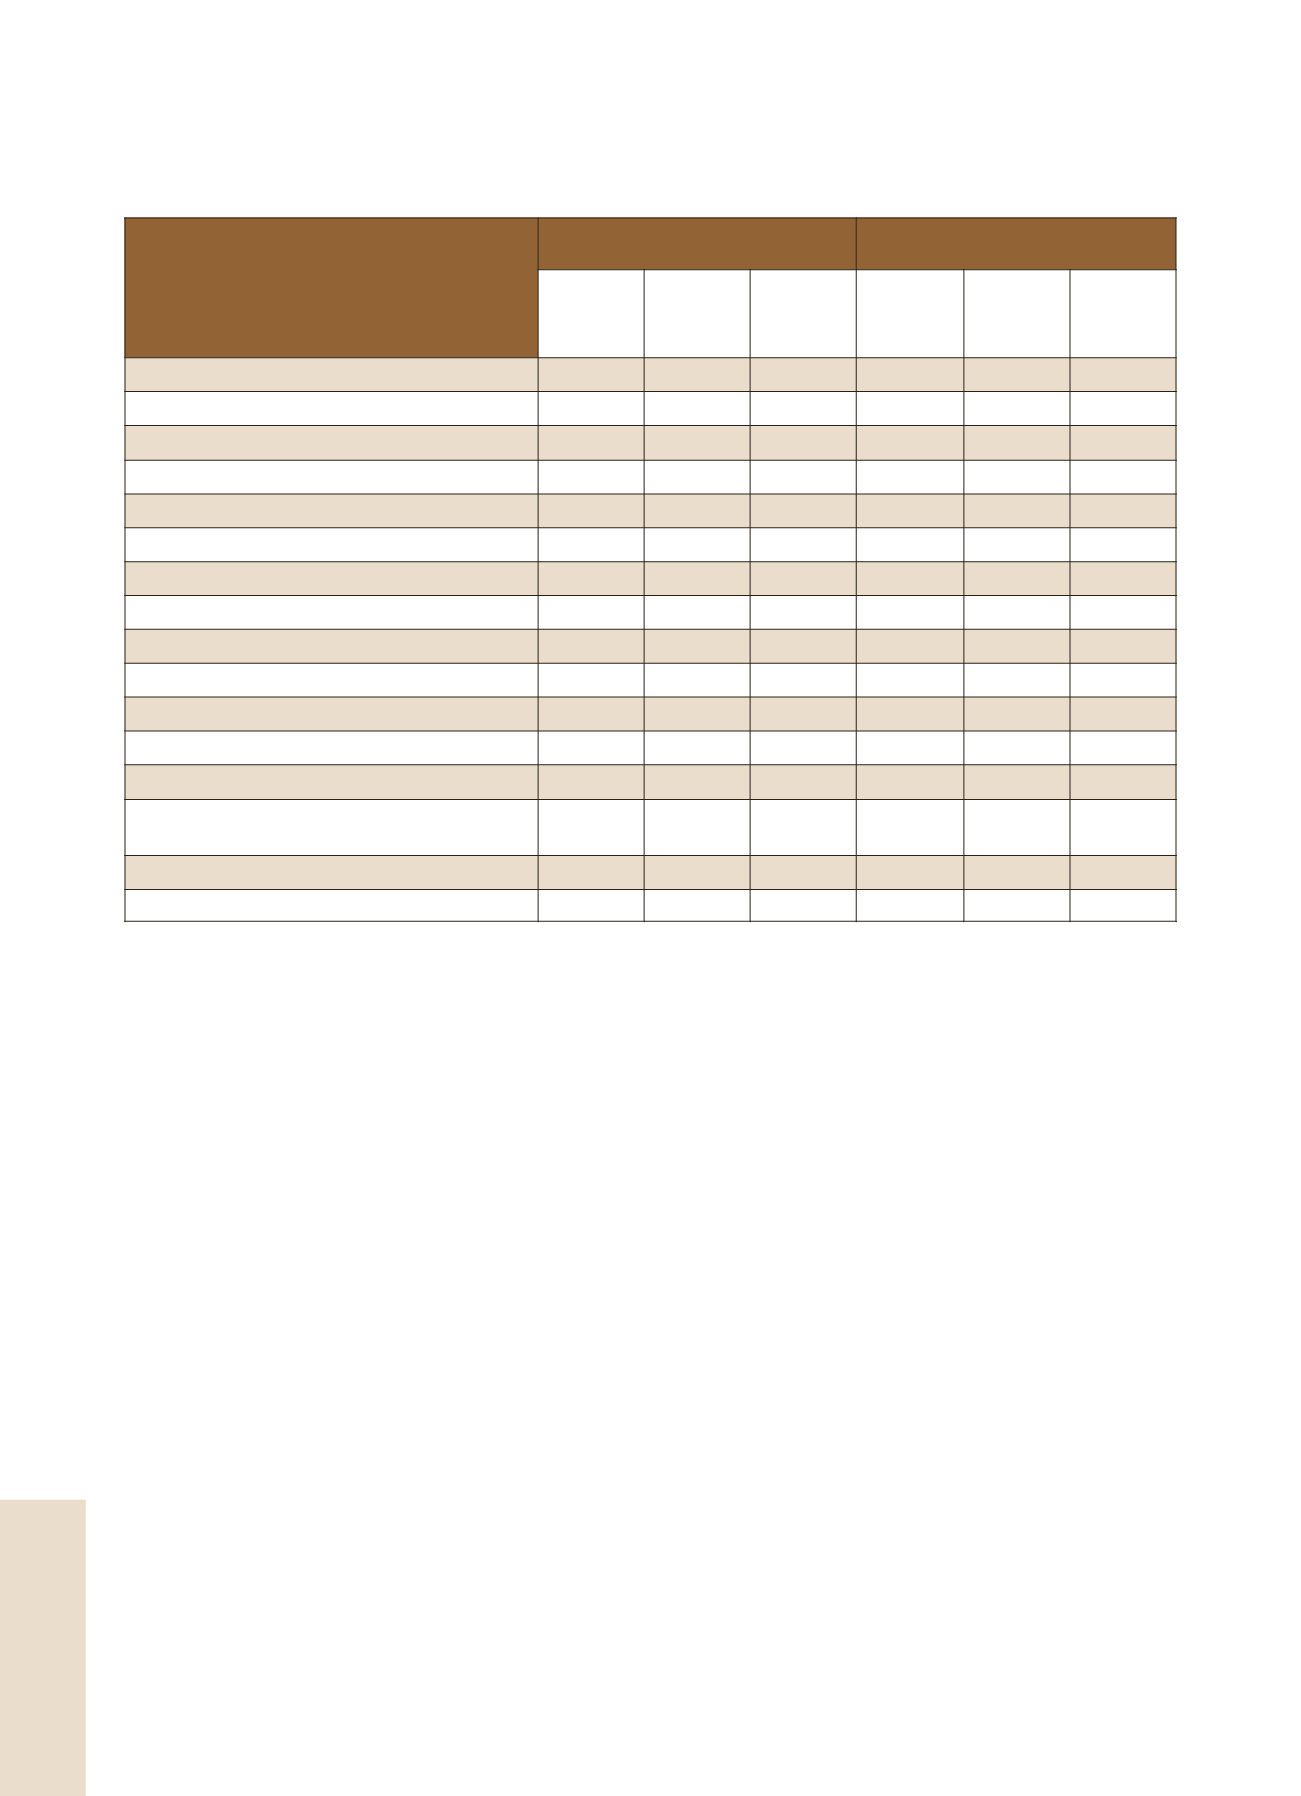
Annual rates of change of turnover index and volume index in retail trade
(2005=100)(Working day adjusted data, according to the real number of working days)
Retail Trade Business
Turnover Index
Volume Index
Index
October
2010*
Index
October
2009
Annual
rate (%)
Index
October
2010*
Index
October
2009
Annual
rate (%)
Overall Index
110.1
112.3
-2.0
90.6
98.6
-8.1
Overall Index (except automotive fuel)**
102.9
110.9
-7.3
87.5
97.6
-10.3
I. Main sectors
Food sector
114.8
119.3
-3.8
93.6
103.0
-9.1
Automotive fuel sector
136.2
101.1
34.7
84.9
87.0
-2.4
Non-food sector (except automotive fuel)
93.6
104.7
-10.6
82.9
93.7
-11.5
II. Specialized store categories
Supermarkets
117.0
122.7
-4.7
97.5
107.3
-9.1
Department stores
106.2
116.4
-8.8
96.1
107.5
-10.6
Automotive fuel
136.2
101.1
34.7
84.9
87.0
-2.4
Food-beverages-tobacco
104.6
102.9
1.7
85.3
88.8
-3.9
Pharmaceutical products, cosmetics
101.4
117.0
-13.3
98.3
110.1
-10.7
Clothing and footwear
105.8
116.5
-9.1
88.4
99.6
-11.3
Furniture, electrical equipment, household
equipment
88.6
103.5
-14.3
85.2
99.8
-14.6
Books, stationery, other goods
85.6
86.7
-1.3
75.8
79.0
-4.1
Retail sale not in stores
93.8
108.2
-13.4
:
:
:
In October 2010, the turnover index in retail trade (excluding automotive fuel) decreased by 7.3%, year-on-year. In
October 2010, the Volume Index in Retail Trade, not including automotive fuel and lubricants, decreased by 10.3% year-
on-year.
* Provisional data
:Not available data


