Trade with Greece
161
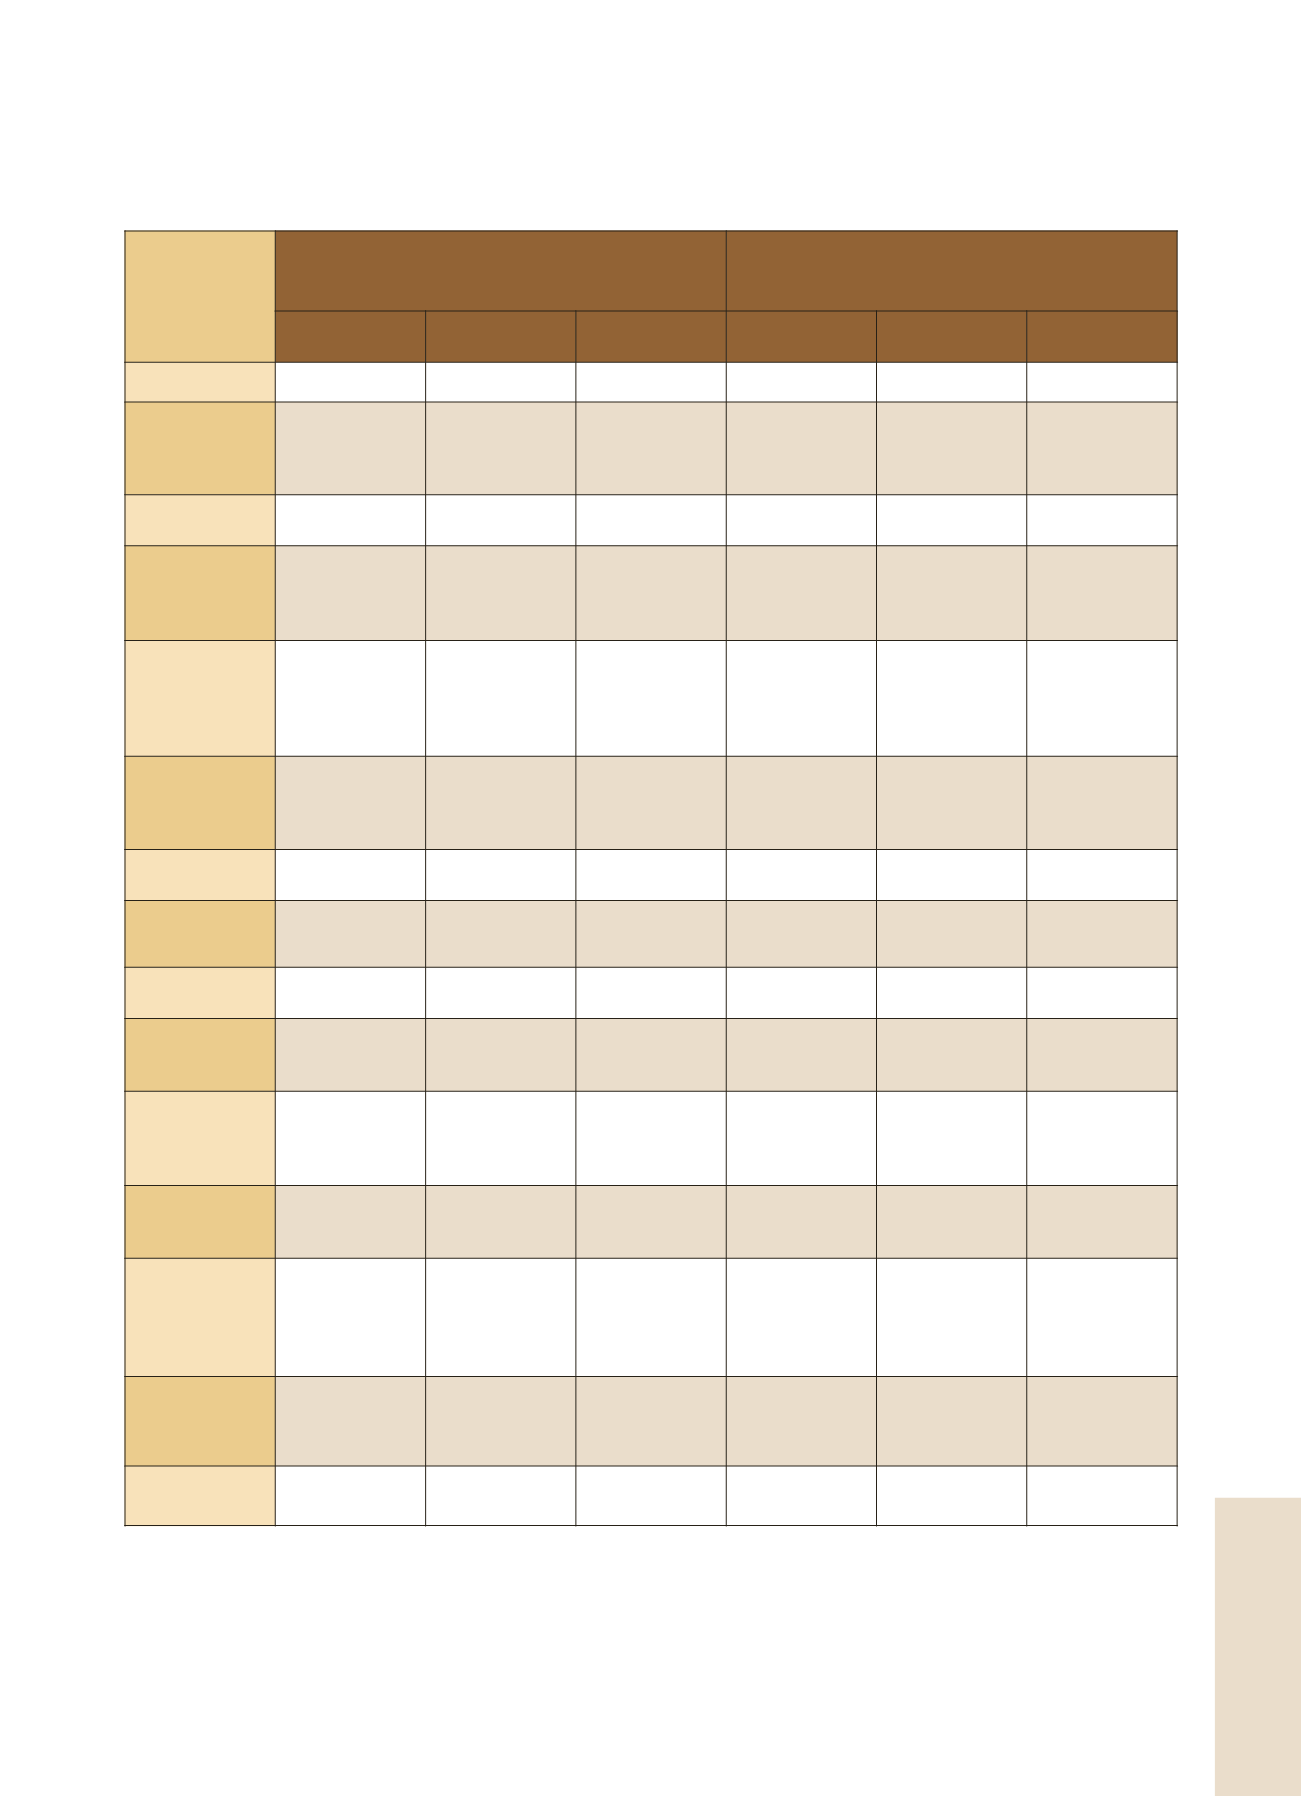
Average turnover index and volume index in retail trade for the period
January-October
(Working day adjusted data, according to the real number of working days)
Retail Trade
Business
Turnover Index
January-October
Volume Index
January-October
2010*
2009 Change (%)
2010*
2009
Change (%)
Overall Index
110.1
109.0
1.0
93.5
97.4
-4.0
Overall Index
(except auto-
motive fuel)**
105.1
108.1
-2.8
91.9
96.3
-4.5
Ι. Main sectors
Food sector
Automotive fuel
sector
117.4
118.5
-0.9
97.4
101.2
-3.7
Non-food
sector (except
automotive
fuel)
122.5
95.8
27.9
81.4
88.9
-8.4
ΙΙ. Specialized
store cate-
gories
95.4
100.3
-4.9
87.8
92.9
-5.5
Supermarkets
119.7
121.0
-1.1
101.4
105.2
-3.6
Department
stores
106.4
117.9
-9.8
98.0
109.8
-10.7
Automotive fuel
122.5
95.8
27.9
81.4
88.9
-8.4
Food-bever-
ages-tobacco
107.0
106.3
0.6
88.8
90.8
-2.2
Pharmaceutical
products,
cosmetics
112.9
112.9
0.0
107.5
106.6
0.8
Clothing and
footwear
96.0
104.8
-8.4
86.6
95.5
-9.3
Furniture, elec-
trical equip-
ment, house-
hold equipment
91.4
100.1
-8.7
89.1
97.5
-8.6
Books, sta-
tionery, other
goods
84.0
84.3
-0.3
75.5
77.0
-2.0
Retail sale not
in stores
98.3
105.4
-6.8
:
:
:
* Provisional data
** Corresponds to the overall index in retail trade which was published by the NSSG until December 2008
: Not available data


